Table of contents
Related articles
Overview
Mark Twain quote: "The danger is not what we don't know, it's what we know for sure and that is not so."
The satisfaction survey is a good way to open communications with users and measure the level of service efficiency.
This way, you can:
- Demonstrate your commitment to customers.
- Provide a tool for your users to tell you why they are not satisfied with the service.
- Improve the service quality.
- Measure the performance of the team.
The built in customer survey in Octopus is simple, but efficient and does not require much configuration.
At the resolution of a request, the user can access the survey directly from the resolution email and give a mark in relations to the service received, he can also add a comment. The survey is also available from the Web Portal.
How it Works
The satisfaction survey is already included in Octopus and can be activated in a few steps. Before we get to the configuration, let us look at what is included in the survey.
What you need to know:
There are specific permissions required to configure, see the report and when required, modify the satisfaction data:
- Administer Octopus, for the configuration.
- Access the dashboard, statistics and reports, to see the reports related to the survey.
- View satisfaction data, to see the data (notes and comments) within a list in Octopus.
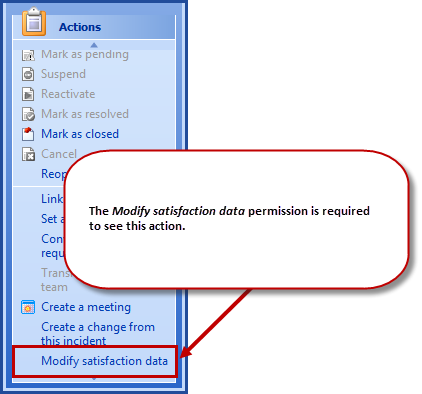
- Modify satisfaction data, to access the action of the same name, which allows to change the data while keeping note of the original data.
Customer Experience
From the Resolution Email
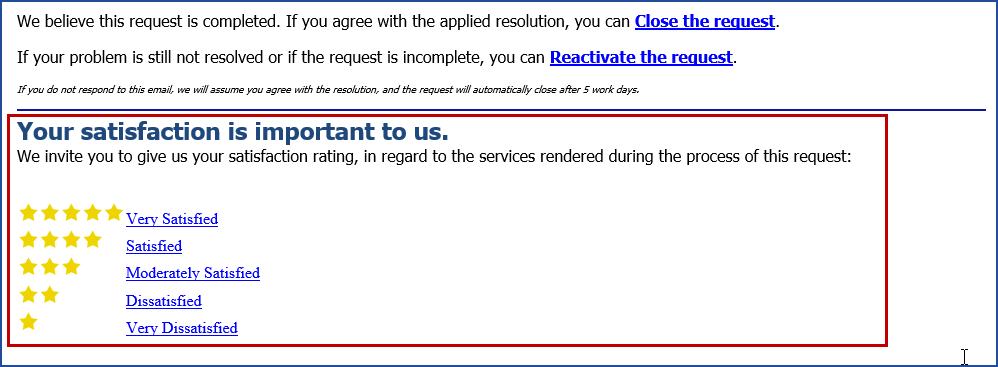
An email can be sent automatically to the user, at the resolution of an incident or service request, that includes a "survey" section.
The user is presented with a scale from 1 to 5 where 1 equals Very Dissatisfied and 5 equals Very Satisfied.
When the user selects the mark, it automatically gets recorded in Octopus and the comment window opens onto the Web Portal.
The comment is not mandatory.
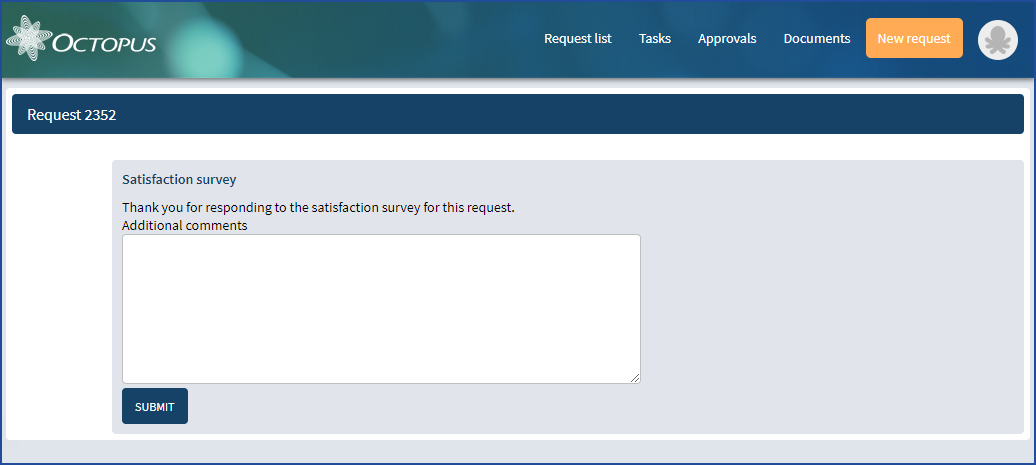
Once the comment added, only the thank you message will remain.
If the user tries to complete the survey a second time, a warning message will appear: "The satisfaction survey response has already been received for this request. Thank you."
From the Web Portal
The survey can also be completed from the Web Portal. At the resolution of an incident or service request a link to the survey appears directly beside the request.
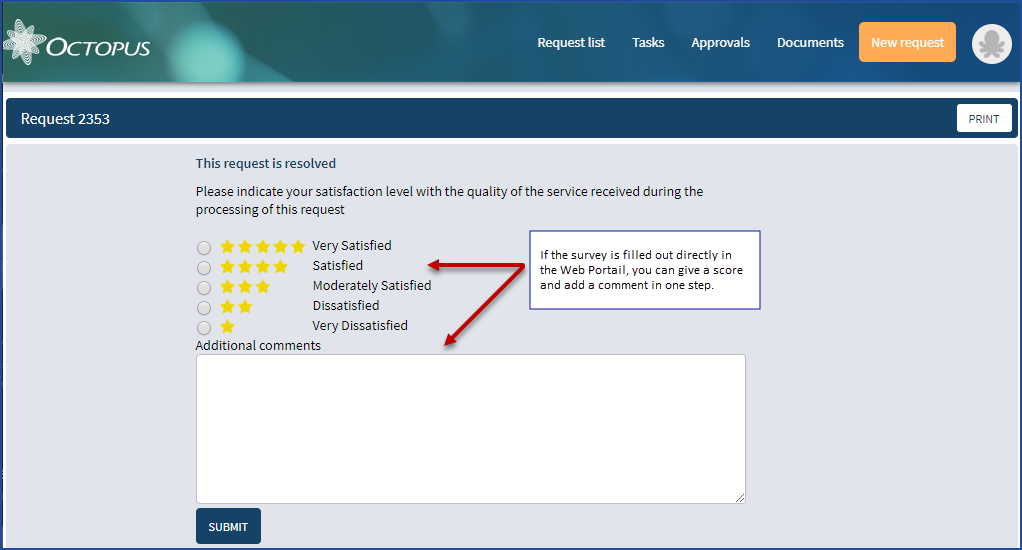
This link allows to fill in the mark and comments directly on screen.
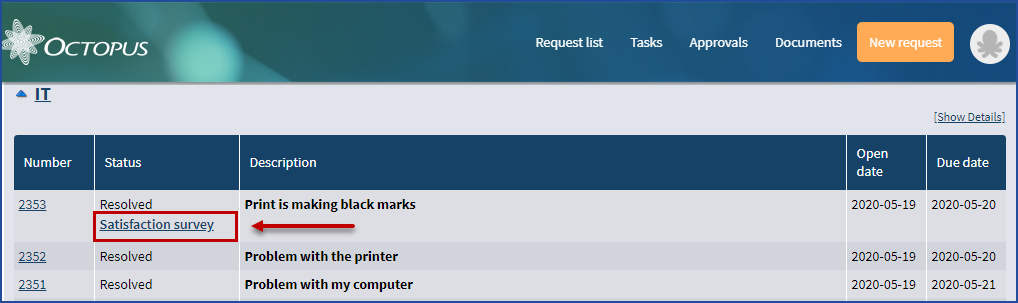
Once the survey completed, the link will disappear.
It is possible:
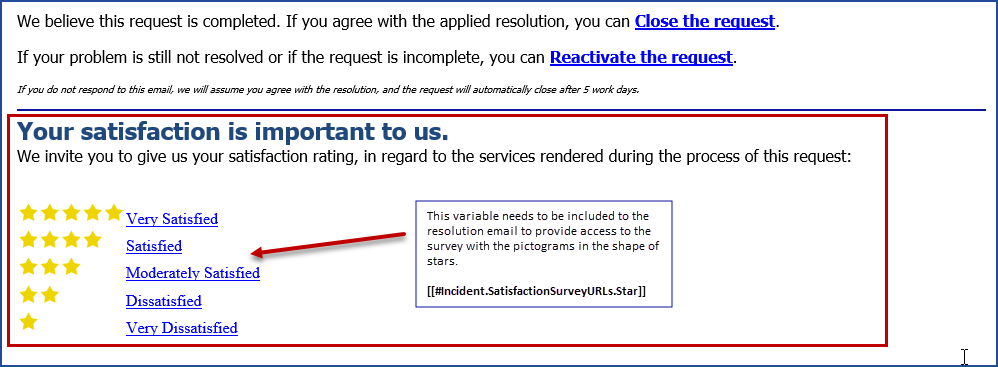
- To used pictograms in the shape of stars to better see the choices available.
- To make the comment mandatory, for example if you want an explanation for a dissatisfaction note. The configuration section explains how further.
Information in Octopus
Once the survey has been activated, the information will automatically update Octopus each time a user completes the survey. The information can be found in a list called Satisfaction Rating and in the statistics.
Satisfaction Rating List
A predefined list named Satisfaction Rating can be added, it returns the requests for which a survey has been completed.
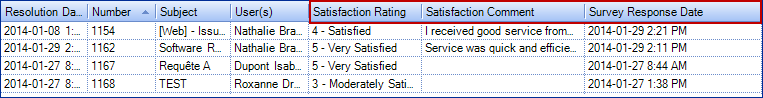
This list contains, among others, the three columns linked to the surveys:
- Satisfaction Rating
- Satisfaction Comment
- Survey Response Date
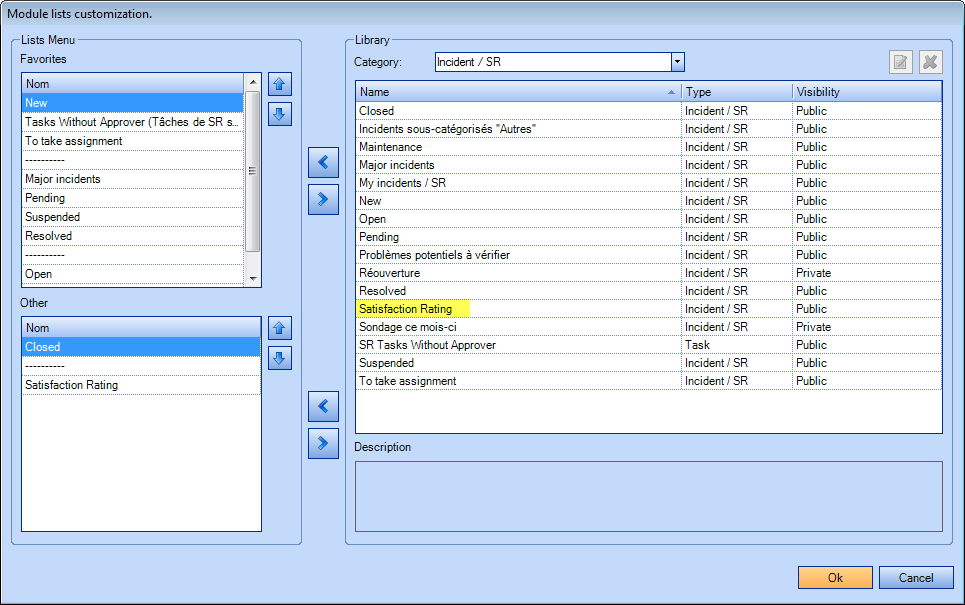
Of course, it is possible to create other lists as needed using the columns associated to the survey. For more information on lists, see the List Customization Wiki.
Satisfaction Statistics Section
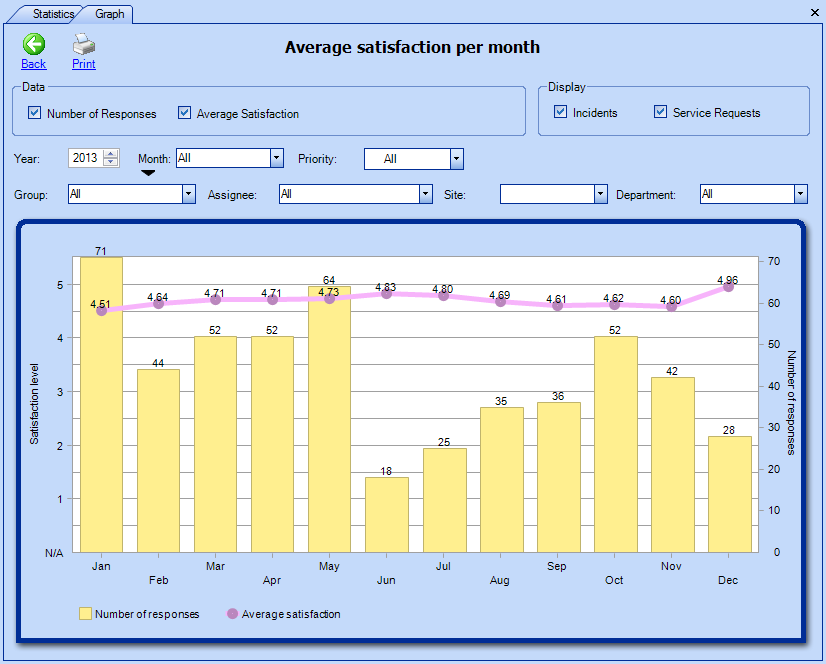
Survey statistics have already been provided in Octopus. Two reports related to the survey can be found that can be filtered in many ways:
-
Average satisfaction per month.
-
Number of responses.
-
Average satisfaction.
-
Incidents.
-
Service requests.
-
And another filter can return them by:
-
Year.
-
Month.
-
Priority.
-
Group.
-
Assignee.
-
Site.
-
Department.
-
-
-
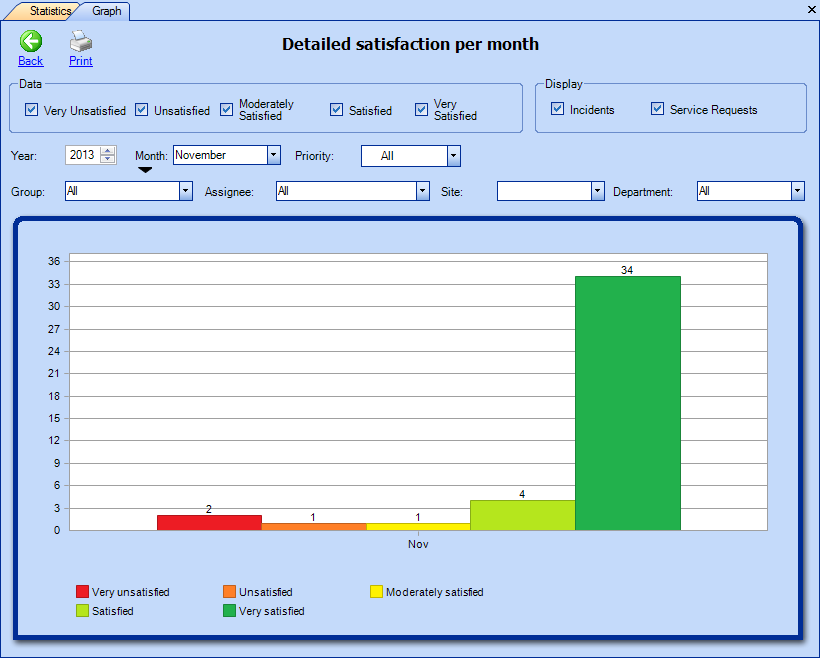
Detailed satisfaction per month.
-
Most data from the average satisfaction, plus the following filters:
-
Very Unsatisfied.
-
Unsatisfied.
-
Moderately Satisfied.
-
Satisfied.
-
Very Satisfied.
-
-
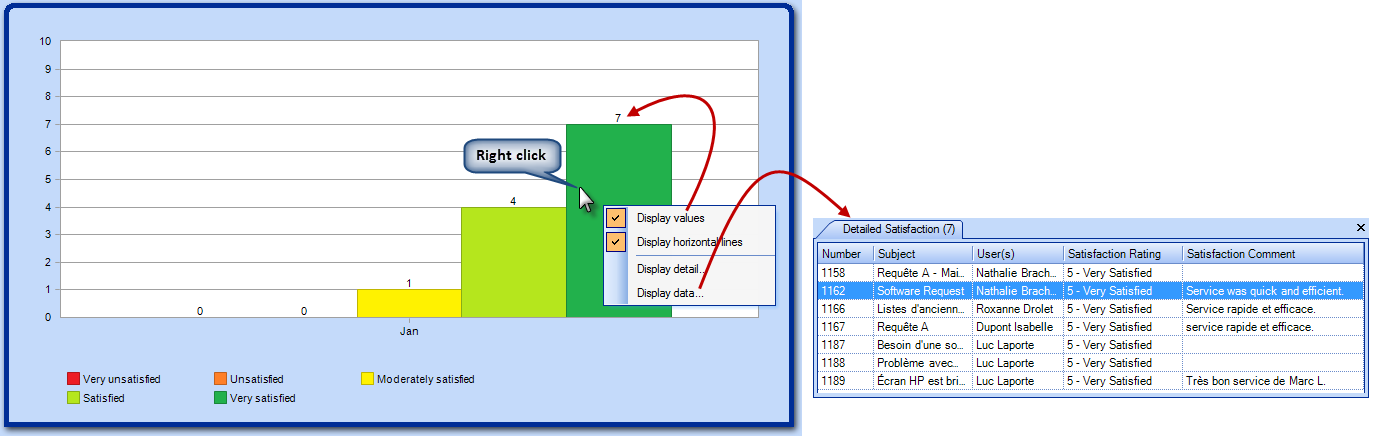
These reports can be printed or saved in PDF format. Other options are also available with a right click on one of the columns:
- Display values.
- Will make the number represented by the column appear above it.
- Display horizontal lines.
- Will show the horizontal lines.
- Display details.
- Goes into the graphic in more details.
- Display data.
- Opens a side window with the requests linked to the graphic column that was selected
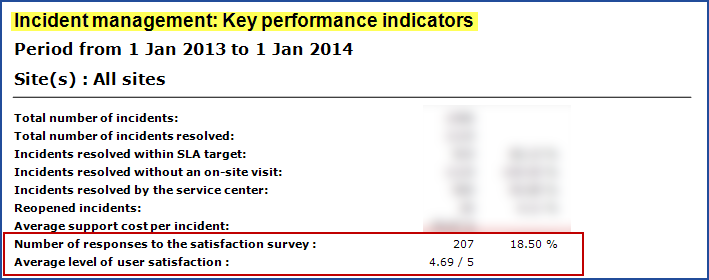
KPI Information
We find the participation rate to the survey inside the Key performance indicators (KPI) of the statistics for incidents and service requests. In the first section of the report, we can see:
-
Number of responses.
-
Percentage of what this number represents.
-
Average level of user satisfaction for the selected period.
Modification of the satisfaction level selected by the user
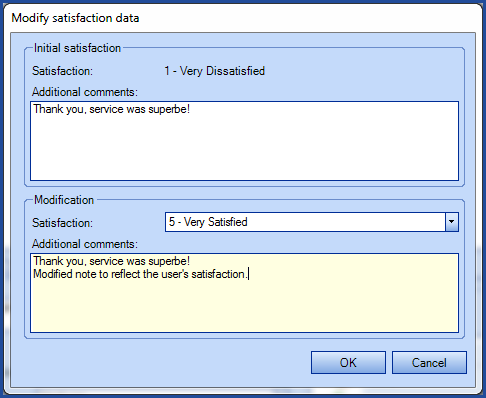
The Modify satisfaction data action allows to change the satisfaction level and comment added by the user in the satisfaction survey.
When modifying the satisfaction data, a window will come up to the Octopus user with the choices selected by the user at the top and a modification section at the bottom.
Two columns can show the initial satisfaction data:
- Initial Satisfaction Rating.
- Initial Satisfaction Comment.

Advantages to Using
-
Activating the survey in Octopus is quick and simple.
-
Opens communication with the users about their satisfaction.
-
Demonstrates to the users that you pay special attention to customer service.
-
Provides possible solutions or improvements to the service.
-
Allows to see the evolution of the service, from month to month or year to year.
Key Success Factors for the Solution
To make the use of survey even greater, take the time to reflect and prepare the following points.
Communication with the Users
Inform your users of the survey activation, explain how it works and display the results with transparency. Communicate your results on a regular basis and highlight your success stories as well as your ideas for improvement. Users will know that you take the time to read their opinion and will continue to complete the survey.
In some cases, direct communication with the users that shared their dissatisfaction can allow you to work with the customers to improve your services or to provide a better understanding of the services offered. Sometimes, the customers may write a mark that is not a reflection of their opinion of the service rendered, but their dissatisfaction with the answer that was given to them. For example, if a user wanted an equipment update that was refused.
Regular Review and Analysis of Results
Take the time to look at the survey results regularly, the information can be filtered in different ways to highlight:
- The number of responses.
- The satisfaction by group/user.
- If the satisfaction rate is greater for:
- Incidents.
- Service requests.
- A particular site.
- A particular department.
- A month in particular.
If at times your results are bellow the desired target, analyze the survey responses in detail and use the information to understand the dissatisfaction and in your recovery plan.
Manage Expectations
Surveys are a method among others to gather information on your service. But even in an environment that promotes it, the participation rate will not be at 80%. You can generally expect a response rate between 10% to 20%, but this rate is still appreciable, since it gives you access to the customers impressions in relations to specific requests. You should also expect to receive feedback from users who will tell you their are not happy with the decisions of the company and not with the service. Each bad mark is not always directed aimed at the service, but as you survey customers, you should expect that some people will blow off steam. That is the reason why certain cases need to be analyzed in details.
In general, if a person takes the time to respond, it is because they think that the service is important and the information provided will be useful.
How to Configure?
The configuration is done in two steps from Tools > Options
- Add the survey variable to the resolution email.
- From the Emails to users section, you need to add one of the two variables in the resolution email:
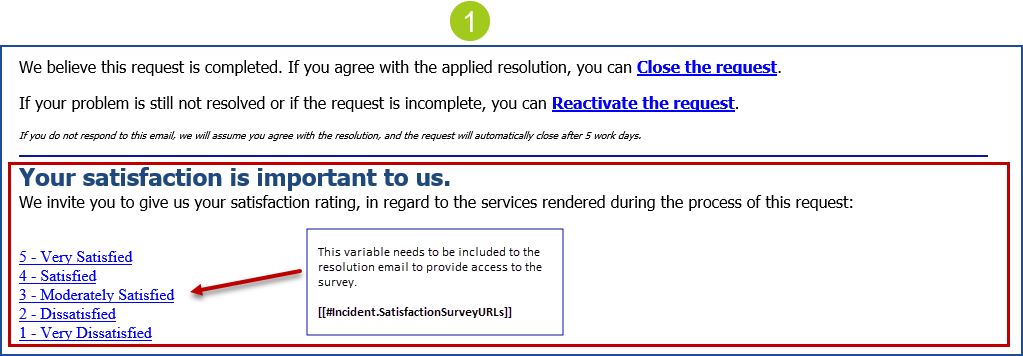
- #Incident.SatisfactionSurveyURLs: View the option available for the satisfaction survey
- #Incident.SatisfactionSuerveyURLs.Star: View the option available for the satisfaction survey with the star shaped pictograms.
You must add context to the variable to make it clear to users. For example: - "Your satisfaction is important to us".
- "We invite you to give us your satisfaction rating, in regard to the services rendered during the process of this request: #Incident.SatisfactionSurveyURLs".
- From the Emails to users section, you need to add one of the two variables in the resolution email:
- Activating the survey.
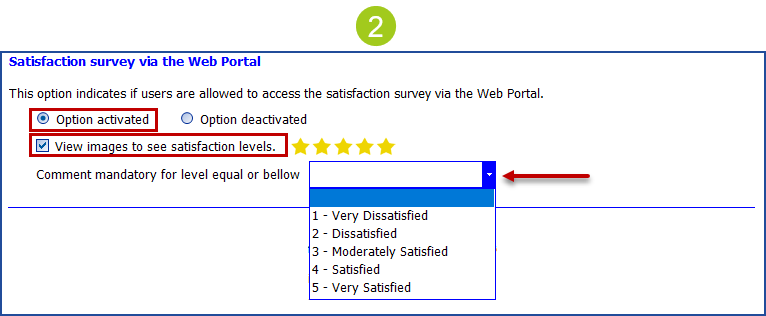
- From the Options, activate the one named Satisfaction survey via the Web Portal.
- Select or not to View images to see satisfaction levels
- Select if a comment will be mandatory for level equal or below a particular level
- The change will be done after Octopus restarts.
Thank you, your message has been sent.